Accessibility
Color Contrast
Charts & Graphs
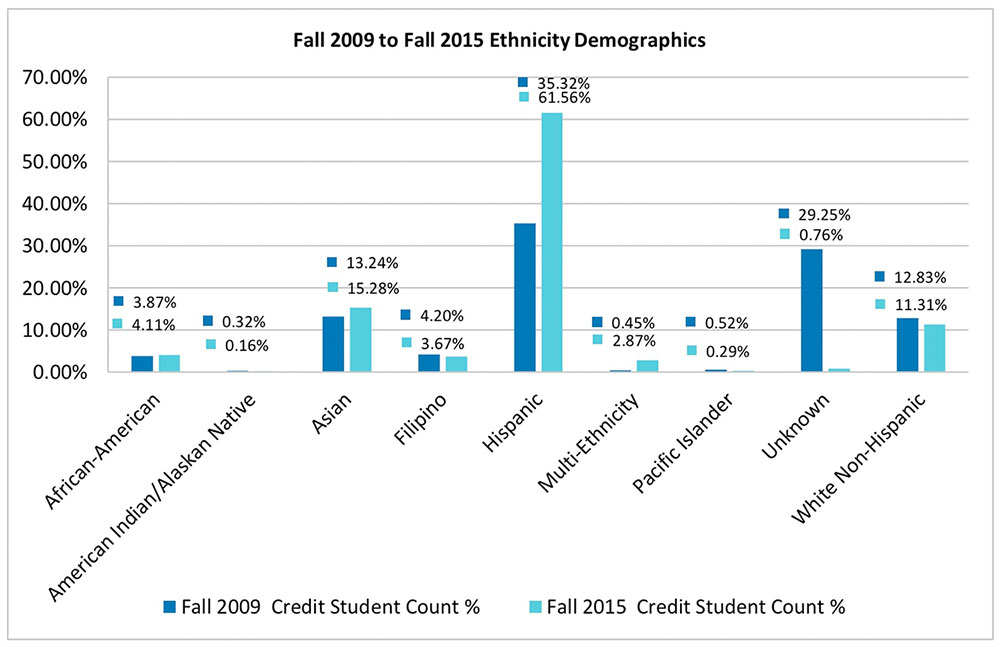
Alt Tag: Fall 2009 to Fall 2015 Ethnicity Demographics Chart.
Long Description (sample 01): "Figure 2 is a comparison of the ethnicity demographics between Fall 2009 and Fall 2015, showing the percentage of students in each ethnic category compared to the total student population. The demographics show African-American increased from 3.86% to 4.11%; American Indian/Alaska Native decreased from 0.32% to 0.16%; Asian increased from 13.24% to 15.28%; Filipino decreased from 4.20% to 3.67%; Hispanic increased from 35.32% to 61.56%; Multi-Ethnicity increased from 0.45% to 2.87%; Pacific Islander decreased from 0.52% to 0.29%; Unknown decreased 29.25% to 0.76%; and White Non-Hispanic decreased from 12.83% to 11.31%."
Long Description (sample 02): "The Fall 2009 to Fall 2015 Ethnicity Demographics chart shows a comparison between percentage of ethnicities present on campus during the fall 2009 term and the fall 2015 term. Most notable are the changes with students who self-identify as Hispanic and unknown. When compared to the 2009 percentages, the Hispanic demographic increased by 20.9% while the unknown demographic decreased by 28.49%. Here are all the demographics shown in the graph. The following demographics increased; African-American from 3.86% to 4.11%, Asian from 13.24% to 15.28%, Multi-Ethnicity from 0.45% to 2.87%, and the greatest increase Hispanic increasing from 35.32% to 61.56%. The following ethnicities decreased American Indian/Alaska Native from 0.32% to 0.16%, Filipino from 4.20% to 3.67%, Pacific Islander from 0.52% to 0.29%, White Non-Hispanic from 12.83% to 11.31%, with the greatest decrease being those students identifying as "unknown" from 29.25% to 0.76%."
<img src="sales.jpg" alt="Line chart of annual sales data" longdesc="salesdata.htm"><br>
<a href="salesdata.htm">View sales data</a>
