Canvas Analytics Home
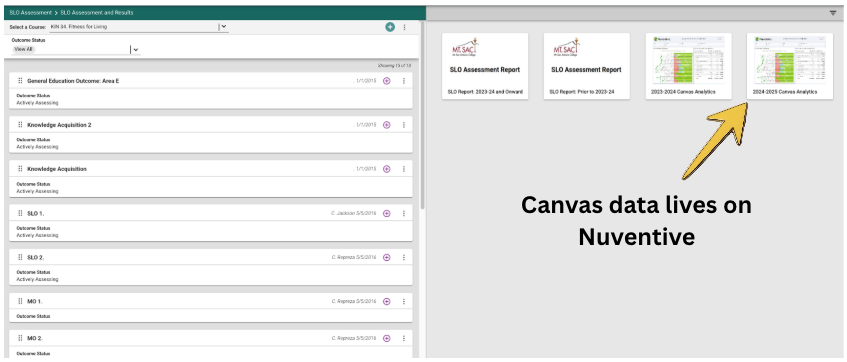
The Outcomes Committee is excited to present Canvas Analytics for Outcomes Assessment. If you use an assignment on Canvas to assess an SLO. That data can be accessed directly in Nuventive. Data from all sections using that assignment or any assignment for the same SLO can be collected and compared.
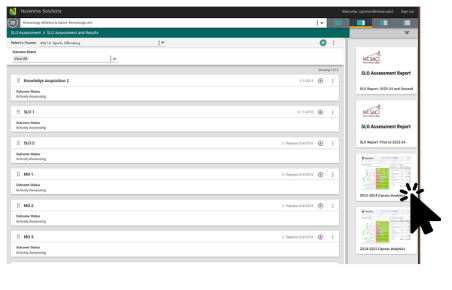
Select school year
Canvas data is grouped by school year. 2023-2024, 2024-2025. Select the year that you are collecting data from.
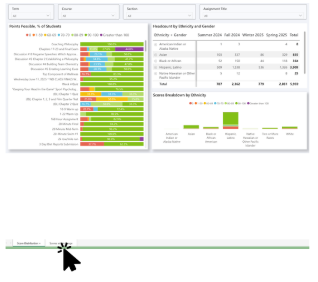
Select Scores within Range tab
This will allow you to disaggregate data from students who did not meet outcomes requirement
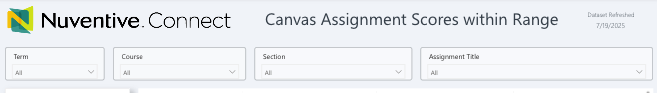
Information needed for Canvas Assignment Scores within Range
You will need to select the semester(s), course, section(s), and name of the assignment(s). We recommend you put SLO # in name. For example:
- Writing Assignment SLO 01
- Lab Assignment SLO 01
- Presentation SLO 01
The assignments DO NOT have to be the same the SLO must be the same. You will be able to filter by assignment name "SLO 01" and select multiple assignments. This allows professors to use their desired assignment for assessment.
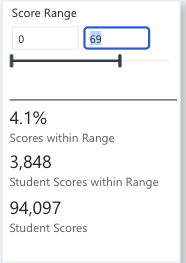
Scores Range
Next enter the scores that you would like to look at. Outcomes recommends you look at data of students not meeting outcome. For example if the goal is students will score 80% or higher enter 0-79.
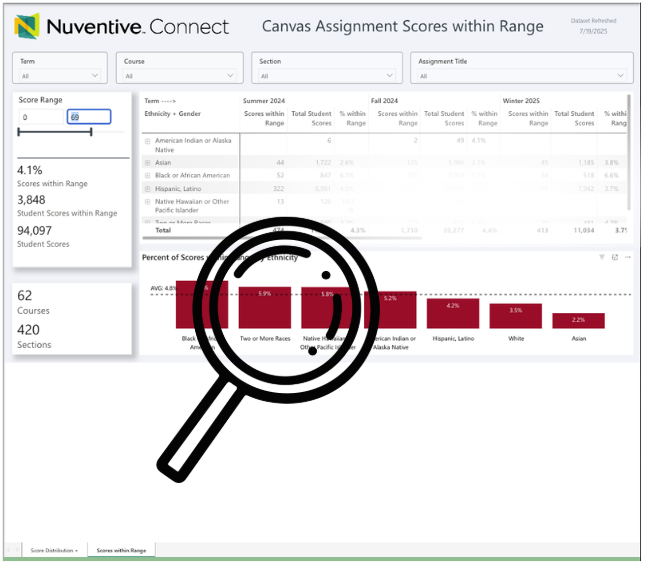
Now dig in
Now you can drill down into data and see where improvements can be made. Reflect and Collaborate within department. Develop Action steps for upcoming semesters.
If you'd like help developing an assessment assignment meet Otty the Outcomes assessment assistantscan the QR code below

.
